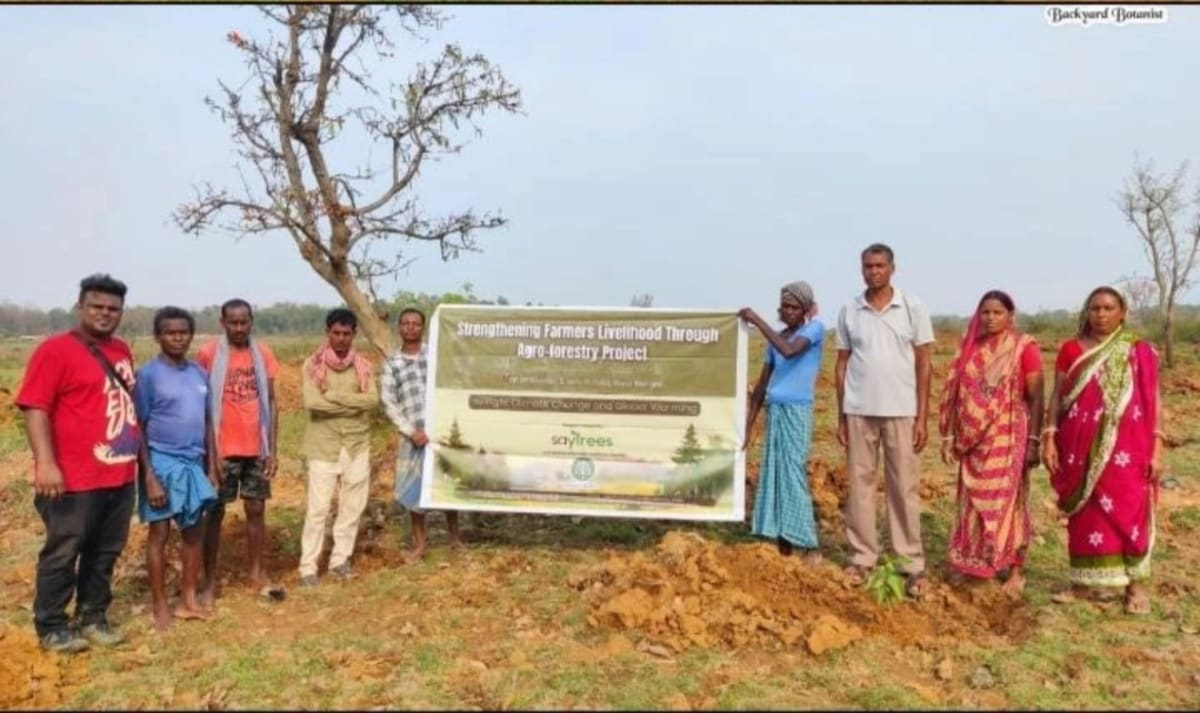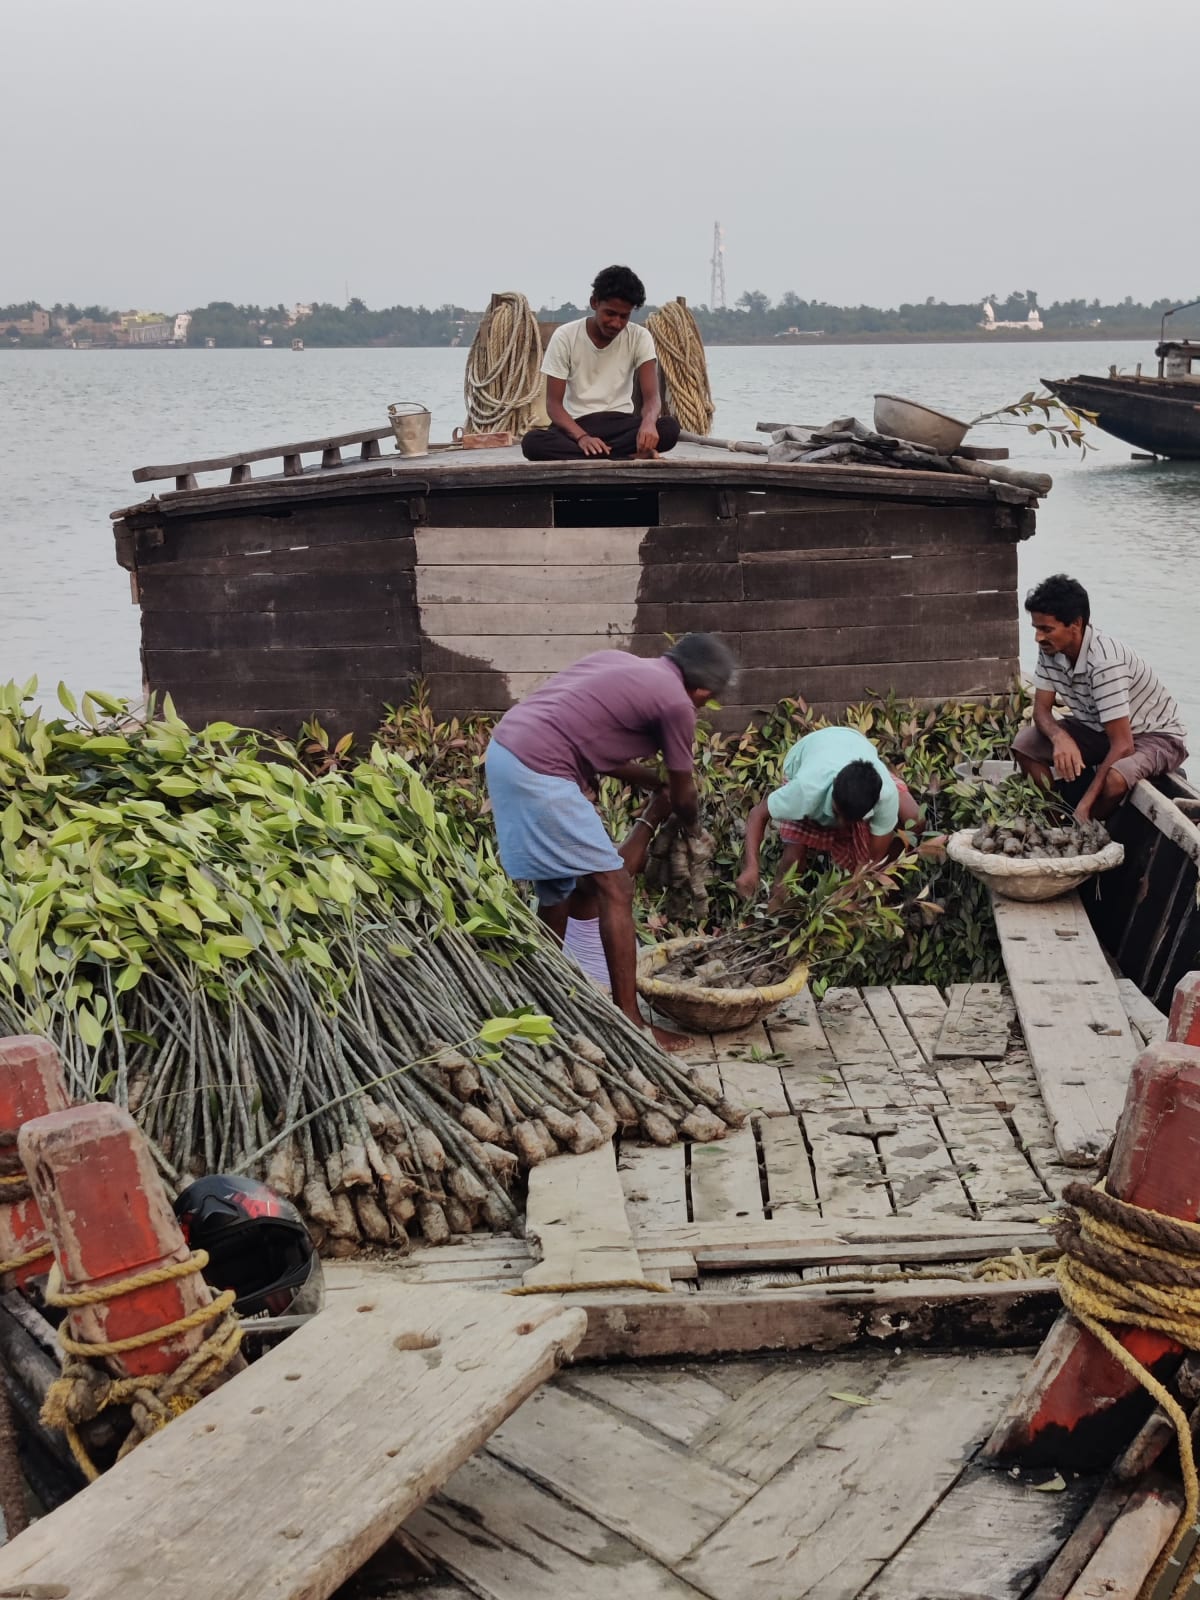
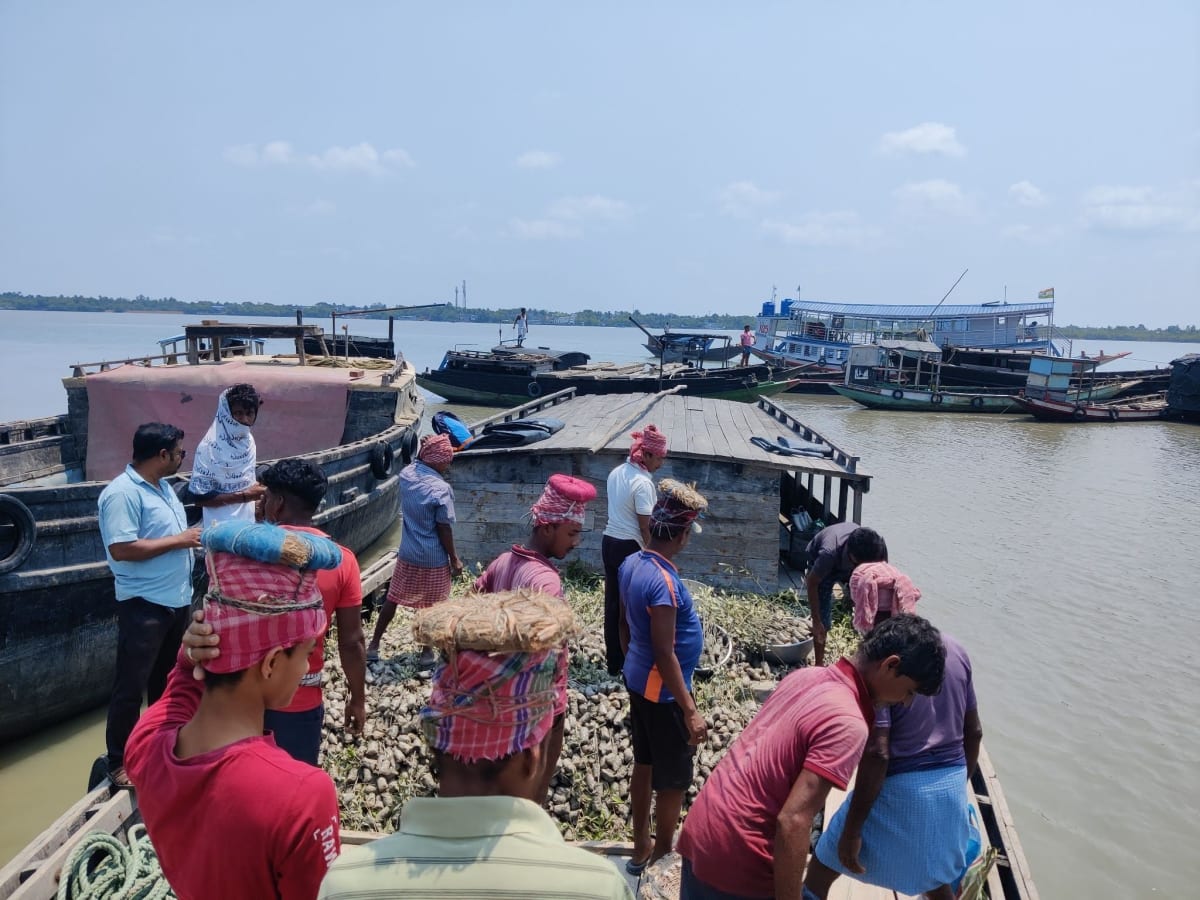
We restore ecosystems for a living. Mangroves in the Sundarbans, dense native Miyawaki forests in and around Kolkata with partners like NKDA and HIDCO, and an agroforestry programme spread across 100+ smallholder farms in West Bengal.
The planting is the visible part. The harder part, and the part almost nobody asks about at the start of a project, is proving what happened afterwards.
The measurement problem nobody puts in the brochure
A plantation is easy to document on day one. You have a date, a location, a sapling count, and a set of photographs. That is enough for a press release and, unfortunately, enough for a lot of project reports.
It is not enough to answer the questions that actually matter three years later. How many of those saplings are alive? Which species failed, and in which part of the site? How much carbon has that biomass accumulated? Has the surrounding ecosystem changed in a way you can show rather than assert?
Answering those questions the traditional way means field sheets, GPS handhelds, photographs on someone's phone, and a spreadsheet assembled months afterwards. Every step in that chain loses something. Handwritten plot data gets transcribed wrong. Photographs lose their coordinates. Sites drift out of their mapped boundaries. And when an auditor eventually asks where a specific number came from, the honest answer is often that someone reconstructed it from memory.
That is the real problem with restoration measurement. It is not that people lie. It is that manual data collection makes trust a matter of reputation rather than evidence, and reputation does not survive a verification body's questions.
Why we went looking for a partner instead of building it
We considered building our own monitoring stack. We decided against it for a straightforward reason: the difficulty is not writing a data capture form, it is keeping that data aligned with carbon standards and methodologies that keep evolving, and then defending it under audit.
So we partnered with Flora Carbon AI, a Kolkata based team that develops nature based carbon projects and builds the digital MRV tooling that sits underneath them. That combination mattered to us. They are not a software vendor guessing at what field work looks like; they run projects of their own, including mangrove work in the Sundarbans and smallholder agroforestry, so the tooling reflects conditions we recognise.
What dMRV actually changes on the ground
There are three parts of our work where the difference is concrete.
Field data capture. Measurements are recorded on a mobile app at the point of observation, with location and timestamp bound to the record. Individual trees and monitoring plots can be tagged and revisited, so a survival count in year three refers to the same trees that were measured in year one. This is the least glamorous change and by far the most important one, because it eliminates the transcription gap where most data quality is lost.
Spatial monitoring. Satellite based screening lets us look at a site's boundary and canopy change over time without commissioning a GIS study for every plot. For mangrove sites in particular, where access is tidal and a full field survey is expensive, remote monitoring tells us where to send a team rather than replacing the team. Satellite data on its own can show that a parcel changed; it cannot tell you which species were planted or by whom. Field records answer that. You need both.
Registry ready reporting. The output we care about is a monitoring report that a verifier can follow back to source observations, and their dMRV platform is built around the major standards and methodologies, so decisions about how a site will be measured are made before the first plot is laid out instead of being retrofitted years later.
Where it earns its place, and where it does not
We want to be precise about this, because dMRV is currently being sold as a solution to everything.
For a single large plantation with one landowner and one uniform planting model, careful conventional monitoring is often adequate. The overhead of digital tooling does not pay for itself.
Where it becomes essential is aggregation. Our agroforestry programme involves 100+ separate farmer landholdings, each with a different layout, species mix, and planting model. There is no version of that project where a spreadsheet holds up. The same applies to mangrove restoration spread across multiple patches of tidal coastline. Many small sites, many separate observations, one claim at the end.
What this means if you fund our work
If you are a corporate, NGO, or government partner funding restoration with us, working with our dMRV partner Flora Carbon changes what we can hand back to you. Not better adjectives, but site level survival data with dates and coordinates attached, spatial records of what your funding covers, and a monitoring trail that holds up when someone outside the project asks how we know.
We think that should be the baseline for restoration work, not a premium feature. Measuring honestly occasionally means reporting that a site underperformed, which is exactly why the measurement has to be built in from the start rather than added when the results look good.